In late 1991, the author moved to Asia as Dresdner Asset Management’s new young economist. Cue lots of earnest work on trade, production and, fortunately, capital flows and monetary variables as well. What I learnt quite quickly was that output trends, consumer spending numbers, and even export figures didn’t seem to matter much to markets beyond the few moments in which the data was released (and in those days, the data was in any case pretty unreliable). Even the corporate profit data was largely ignored – Asia’s big asset price inflation from mid-1992 onwards occurred against a background of negligible rates of earnings per share growth. What mattered was liquidity and whatever was “today’s theme” to drive that liquidity.
That people’s demand for equities (and other assets) was primarily a function of how much liquidity people had in their balance sheets (“multiplied by their confidence at any given time”) sat well with the type of portfolio modelling that I was using, but over time I also came to realize that there was something more subtle going on, in that the equity markets were not really central to the economic model.
There may have been a few wealth effects that impacted spending trends when the markets moved but what the equity markets did not do was provide much in the way of financing for companies and their capital investment. Asia during the 1990s used debt almost exclusively to finance almost everything, and the equity markets in that sense served no great economic function.
Stock markets were somewhere that you traded (incessantly) and in so doing tried to make your fortune, but their economic importance was limited and hence their sensitivity to economic variables generally fleeting. Interest rates and liquidity mattered, not much else did. This might help to explain just why Asian equity market capitalizations have not kept pacer on a relative basis with the Region’s rise in global economic significance. Indeed, I will always remember that the day after trading on the Hong Kong stock exchange was suspended during the 1987 Crash (an interesting move in itself), the Happy Valley Jockey Club just two miles away had its largest ever takings on race night.
This year, stock markets globally have had to contend with Wars (new & ongoing); trade friction; political uncertainty both domestic and international; adverse climate events; and of course, concerns over governments’ ability to fund their now endemic and intractable deficits. Economic growth has been modest, particularly if one looks through the pre-tariff surge in World trade that now looks to be being unwound. Markest have more than climbed a wall of worry it seems; they have had multiple layers of Teflon when it comes to bad news.
We believe that explanation for this is straightforward: Western Markets have started to ape those of Asia a generation ago and liquidity (growth) is now everything. Most people – including most analysts – think that QE is dead but in reality, banking systems are still monetizing large quantities of public sector debt.
Admittedly, there have been changes in the methodology – we are no longer in a world in which governments issue long term debt that is then acquired by a central bank but instead governments are shortening the maturities of their debt issuance and relying on commercial banks or (often leveraged) foreign investors to buy their debt. Ultimately, where there is leverage, there is still a “bank” creating liquidity by using credit to acquire a government security. There are important differences in terms of who receives any “carry” and whether holders have to mark-to-market their holdings but in a monetary sense whether it is a central or a commercial bank that buys a treasury security is relatively immaterial; it is still a QE-like policy and we have witnessed a great deal of this so far this year. Certainly, the impact on liquidity has not been negligible and markets seem to react on a monthly (if not weekly) basis to changes in the ebbs and flows of these activities.
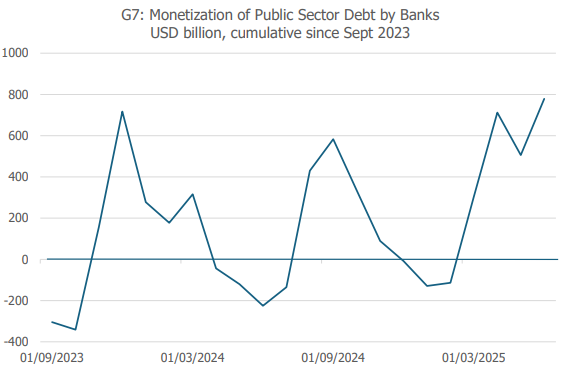
It seems that during September 2023, when global bond markets “wobbled” quite severely under the weight of impending significant issuance, a number of “spooked” governments quickly found ways to get back towards what we would term quasi-QE by selling bonds to banks, drawing on Money Market Funds or their own cash reserves. The system tried weaning itself from the addiction in mid-2024 and early 2025, but the experience proved painful and since March 2025, we have witnessed almost a trillion dollars of liquidity creation via the monetization of G7 government debt.
The current run rate is not that dissimilar to 2020’s Pandemic Response, and we know just how potent that was for markets even as global stagflation dawned in the real economies. Unsurprisingly, I now have a very real sense of Deja-vu forming…..
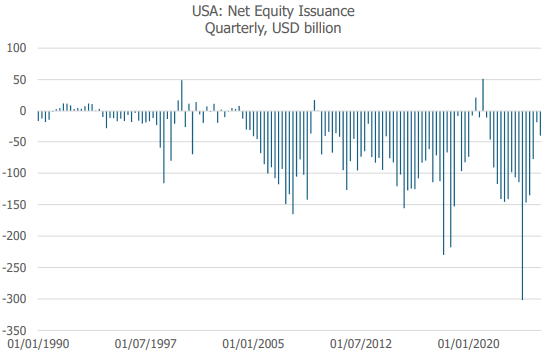
Moreover, we can also note that in terms of raising money for the corporate sector, equity markets now have a very limited role. Perhaps as a result of the prominence of the Employee Stock Option Schemes over the last 20-30 years, net new equity issuance in the USA has rarely been positive in aggregate and frequently very negative as companies issue debt in order to fund buybacks (an agent – principal problem?). Were it not for the movement in prices, the US equity markets would have shrunk, and they certainly are no longer integral to the funding of the corporate sector in aggregate.
The one thing that we know about liquidity driven markets that operate in their own parallel universe (although some may say within their own “bubble”) is that they will eventually burst. The Asian Bubble of the Early- Mid 1990s took five years, Japan’s Bubble Economy imploded after three years but some bubbles in history, such as the Mississippi Bubble, managed close to a decade or in some cases even longer.
We also know that these cycle have to keep moving; leveraged systems must keep inflating or they die and for this they need a consistent source of new credit. This is why they can be very susceptible to rising borrowing costs, although in our experience it is often a constraint on the quantity of new credit that ends the cycle. Foreigners retreating from Asia in 1997 “did the damage”; the BoJ’s de facto credit controls ended Japan’s Bubble, and even the GFC was brought about not so much by higher yields but mathematical problems within the derivatives markets that ended the supply of new credit to the mortgage markets.
What could end this latest cycle? We believe that baring some catastrophic news that markets couldn’t ignore, the two most likely causes would be a creditor strike whereby foreign investors ceased providing sufficient capital inflows to fund not just the US current account deficit but also US investors’ appetite for acquiring foreign assets; or an event in the UST markets themselves that sent yields up and collateral values lower.
Despite the recent “stress tests”, it seems that the bar for a foreign buyers’ strike on US assets is remarkably high. Equity investors are too scared on missing out on US assets, while in reality there is no alternative to US Treasuries for many international bond investors. A lack of foreign buying could be a trigger for ending the current cycle, but it might take a lot more “noise” than we have seen so far to cause such an event.
There could, however, soon be an event in the UST markets. So far this year, the supply of US public sector debt securities in circulation outside the US banking system has declined by $80 billion as issuance has been minimal and banks have topped up their holdings of bonds (i.e. there has been quasi-QE). However, in late August and September we are scheduled to see potentially as much $1 trillion or more of UST issuance in the USA. The US government is also promising to withdraw liquidity from the private sector by rebuilding its own cash balances. There should also be a seasonal pick up in debt issuance in Europe, although Japan’s government may need to borrow less.
In total, we estimate that if governments do what they say they intend to do, then we could see $1.5 trillion of new G7 debt, and a $250 - $500 billion contraction in liquidity. In the context of the first chart that we showed in this report, we are now due a dip down towards the zero axis, and markets did not enjoy the previous dips….
Of course, no one wants the cycle to end and governments do need to fund their deficits, so we can assume that any dip will soon be followed by another surge in debt monetization, even if such blatantly inflationary policies have done little for the health of the real economies or the median household over the last 15 years…. The QE addiction is still with us but there may be an interruption in supply in the near term that causes higher yields and perhaps even a stronger US dollar for a period.
Disclaimer: The information in this report has been taken from sources believed to be reliable but the author does not warrant its accuracy or completeness. Any opinions expressed herein reflect the author’s judgment at this date and are subject to change. This document is for private circulation and for general information only. It is not intended as an offer or solicitation with respect to the purchase or sale of any security or as personalised investment advice, and is prepared without regard to individual financial circumstances and objectives of those who receive it. The author does not assume any liability for any loss which may result from the reliance by any person or persons upon any such information or opinions. These views are given without responsibility on the part of the author. This communication is being made and distributed in the United Kingdom and elsewhere only to persons having professional experience in matters relating to investments, being investment professionals within the meaning of Article 19(5) of the Financial Services and Markets Act 2000 (Financial Promotion) Order 2005. Any investment or investment activity to which this communication relates is available only to and will be engaged in only with such persons. Persons who receive this communication (other than investment professionals referred to above) should not rely upon or act upon this communication. No part of this report may be reproduced or circulated without the prior written permission of the issuing company.
Andrew Hunt Economics Ltd; 10 Union St; St Peter Port; GY1 1PS
Guernsey Registered Company Number 38907