


Snapshot
Volatility rose substantially for most financial assets in the early part of the April–June quarter. In equities, the VIX volatility index rose from relatively benign levels to over 50 in April, showing levels of implied volatility typically only seen during financial distress or a global recession. The fixed income market was also volatile early in the quarter, with10-year US Treasury (UST) yields plunging before sharply reversing course. Markets strengthened as the quarter progressed, with May marking the best month for US stocks since late 2023 and European equities also seeing gains. On the bond side, USTs sold off and yields climbed in the middle of the quarter. Sovereign yields also rose in many other developed economies in the same period. Global equities climbed towards the end of the quarter, with the MSCI All Country World Index rising 4.4% in US dollar terms during the month of June. Within fixed income, the UST yield curve shifted lower towards the end of the quarter, with front-end yields outperforming. By the end of the quarter, the benchmark 2-year and 10-year UST yields had settled at 3.72% and 4.23%, respectively.
Outside of equity and fixed income markets, gold prices initially plateaued towards the middle of the quarter after having climbed significantly over the preceding months. Gold then gained towards the end of the quarter. In addition, West Texas Intermediate crude oil prices and real estate, as measured by the FTSE NAREIT Global Real Estate Index, both advanced in the middle of the quarter. Towards the end of the quarter, crude oil prices jumped further, albeit with sharp price swings, and real estate edged upwards.
In the early part of the quarter, financial asset movements were driven by the first blows of US President Donald Trump’s trade war, to which China responded with a tit-for-tat tariff increase of its own. However, trade tensions eased as the quarter progressed given that the US signed a deal with the UK and agreed with China to dramatically lower tariffs for 90 days. The US also postponed the implementation of a 50% tariff on imports from the European Union to allow for more time for negotiations. Towards the end of the quarter, easing geopolitical risks, hopes for further trade deals by the US ahead of its 9 July tariff deadline and optimism over a possible US interest rate cut in the coming months lifted sentiment. The finalisation of a trade framework between the US and China was also positive for markets. In addition, rising expectations for US monetary easing combined with other factors including depreciation in the US dollar helped to push gold prices higher towards the end of the quarter. Crude oil prices saw volatility in the latter part of the quarter on a flare-up in Middle East tensions and a subsequent ceasefire between Iran and Israel.
Cross-asset 1
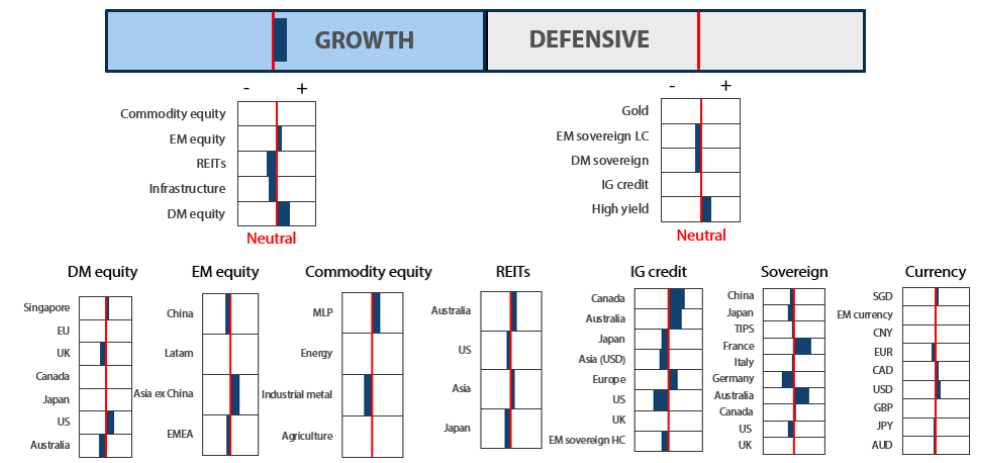
For the April-June quarter, we maintained an overweight position in growth assets, especially in developed market (DM) equities.
Our overweight in DM equities through the quarter reflected the market’s expectations of favourable trade deals and corporate earnings, particularly in the US. Our biggest increases in DM equities were in Japan and Europe, which we lifted to neutral earlier in the quarter. We see potential yen weakness favouring Japan; for Europe, we expect support from monetary policy, with the European Central Bank cutting rates more aggressively than the Federal Reserve.
For the quarter we slightly increased our score in emerging market (EM) equities; we continue to favour countries, like India, which are expected to benefit from domestically-driven economies and structural long-term growth stories. We also continue to favour Taiwan, which is a beneficiary of the current global tech upcycle.
Regarding commodity equities, we maintained a neutral stance through the quarter; we see the assets as attractively-valued and as good diversifiers. We maintained our underweights in REITs and infrastructure during the quarter, as we see better risk rewards in other asset classes.
We maintained a slight overweight on defensive assets but trimmed our score for the quarter amid a slightly stronger outlook for growth due to abating tariff uncertainty. We reduced our DM sovereign scores, particularly that of the US, as the hedged yields look more attractive elsewhere.
We also reduced our gold score for the quarter, given that the assets became expensive. We partially reversed our reduction in gold towards the end of the quarter, reflecting a strategic asset allocation adjustment.
In other segments of defensives, we kept an overweight position in high yields (HY) with their spreads making them an attractive fixed income asset class. For EM sovereigns, we marginally increased our score for the quarter and they are slightly less underweight. EM sovereigns typically benefit from dollar weakness, and we seek to slowly allocate back into these exposures.
Asset class hierarchy (team view2)
Research views
Growth assets: summary of score changes in Q2
Growth assets remain attractive as we expect the global economy to stay resilient despite ongoing uncertainties surrounding US import tariffs. Market sentiment was negative for the first two months of the quarter before improving gradually in June on growing hopes of potential trade deals. While US economic data have shown signs of weakening, they have not collapsed as initially feared. Inflation remained benign globally, providing room for central banks to cut policy rates to support economic growth. In the US, companies continue to post strong results and are now guiding higher, while corporate earnings outside of the US have been softer than expected as the global economy slows.
Overall, earnings growth remains on an upward trajectory, providing support for growth assets. Uncertainties persist due to ongoing trade tariff discussions and legal challenges to the Trump administration. However, clarity may emerge over the next few months as these uncertainties are resolved. In the short term, we note that the passing of the US tax bill is positive and should help to boost consumption and corporate profits. Fed rate cuts in the second half of the year should also be supportive of continued economic activities in the US.
Growth assets topic: investing beyond the technology sector
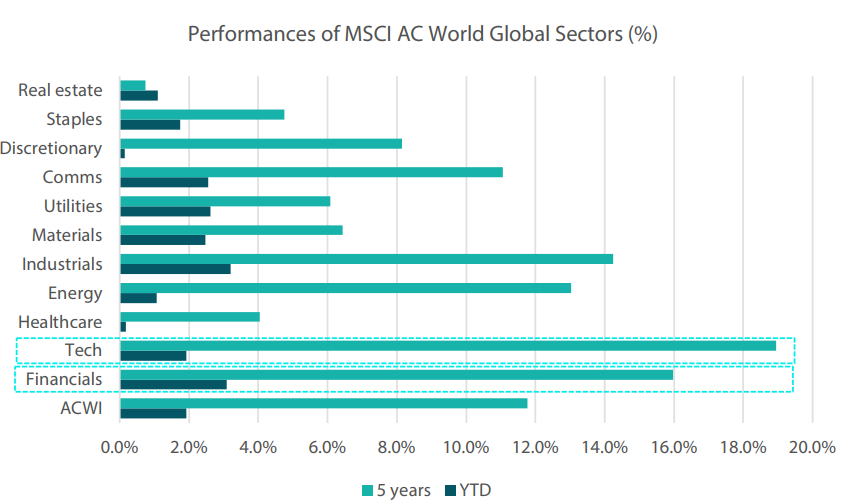
Much has been written and debated on the technology sector, with a particular focus on its secular earnings growth and the recent scrutiny over the returns generated from investments in artificial intelligence (AI) and data centres by the major tech companies. Corporate earnings in the sector had been stellar since the Global Financial Crisis (GFC) and have significantly contributed to the earnings growth of the S&P Index over the past decade. The sector has returned an annualised performance of 19% in the past five years.
Amidst all the hype surrounding the technology sector, there are other sectors that may have been overlooked but offer promising opportunities. When we compare the various sectors of the MSCI AC World Index over the past five years, the financials sector emerges as the next best performer, delivering a surprising annualised return of 16% (see Chart 1). Financials, often seen as a traditional value sector, may not have the same appeal of growth sectors such as communications or technology. Yet it has outperformed many other sectors over the period.
Chart 1: MSCI AC World Financials performance against other sectors
Source: Bloomberg, July 2025
Upon assessing the performance of the financials sector over the period, we found that one of reasons for its outperformance relative to the other sectors is its value-oriented nature. In 2022, the sector experienced smaller drawdowns compared to other growth sectors such as technology and communications. This can be attributed to the financials sector’s less demanding valuations. Growth sectors tend to command higher valuations and are punished harder in a risk-off environment. Growth sectors are also more sensitive to changes in the interest rate environment due to their back-loaded cashflows, resulting in lower intrinsic values when interest rates rise.
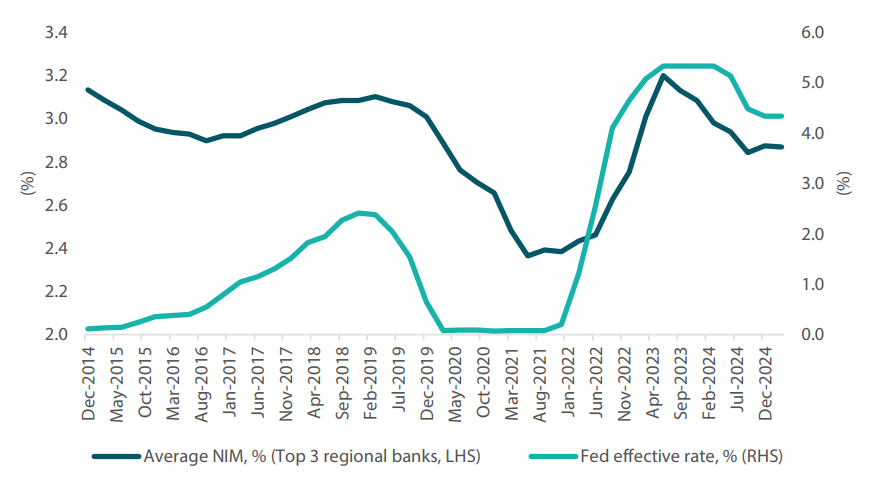
Contrary to its growth sector peers, financials usually perform better in a higher interest rate environment. As interest rate rose on the back of inflation amid resilient economic activities during the period, banks were able to increase their asset yields. This was achieved by increasing loan rates at a faster pace than deposit costs, resulting in the initial expansion of net interest margins (NIM). Consequently, the sector has seen its earnings improve. However, as depositors demand higher returns and deposit costs start to rise, NIMs will contract over time. By examining the top three regional US banks in Chart 2 below, we observe how their NIMs increased as the Fed raised interest rates through 2016–2019 and 2022–2024. As we have been in a “higher for longer” environment since 2022, banks have been able to enjoy strong earnings growth through this period.
Chart 2: Higher interest rates have lifted the NIMs of top three US regional banks
Source: Bloomberg, July 2025
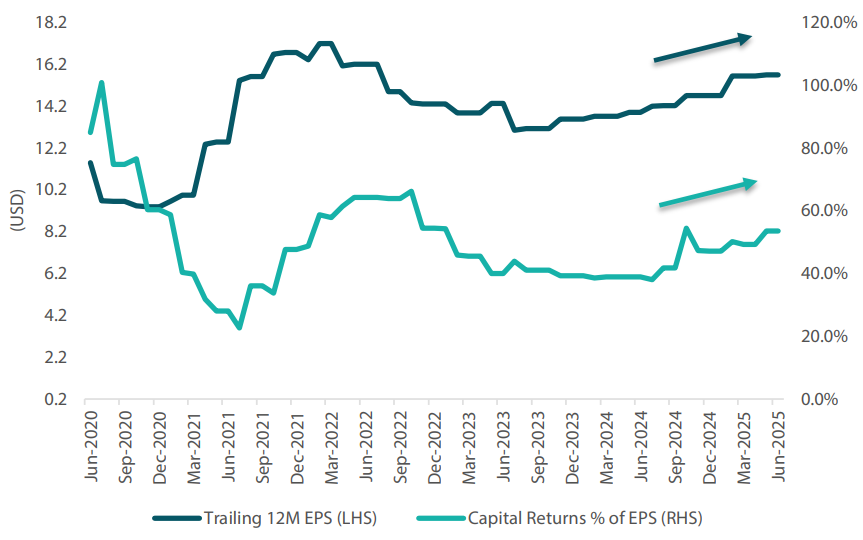
The financials sector is also one of the key beneficiaries of US President Donald Trump’s victory, driven by expectations of deregulation, corporate tax cuts and a rebound in capital markets activity. The sector has been actively redistributing capital to shareholders via dividends and buybacks (See Chart 3), representing about 40–60% of earnings. With Trump’s win, US regulators have loosened capital rules—particularly those concerning the supplementary leverage ratio— enabling banks to increase their capital return. This move is expected to be well-received by investors. With the economy holding up better than expected and capital returns increasing, we expect the sector to continue performing well in the near term.
Chart 3: US financials’ capital returns to shareholders poised to increase
Source: Bloomberg, July 2025
Conviction views on growth assets
- Maintain overweight exposure to US growth for now : We continue to like the US for its secular long-term earnings growth driven by technology and healthcare innovations. We are also positive on increasing energy demand from data centres with the significant AI capex outlay over the next few years. There remains potential for positive surprises in the market, such as responses from central banks and import tariffs relief.
- Overweight on Singapore : We still have an overweight position in Singapore due to its defensive attributes. Singapore offers high dividend yields and low beta. The market is also strong in terms of relative valuation metrics and are least likely to be targeted by Trump’s tariffs policies, given Singapore’s trade balance deficit position.
- Maintain our overweight exposure to EMs : Within EM, we prefer selective markets, such as India, which benefit from domestically driven economies and structural long-term growth stories. We also like Taiwan for its exposure to the technology sector, as it is a key supplier of semiconductors for the secular growth trend of AI capex rollout.
- Neutral on commodity-linked equities : We continue to believe that commodity-linked equities will keep providing ample diversification against inflation in the longer term. The fundamentals of the sector remain compelling due to both cyclical and secular factors.
Defensive assets: summary of score changes in Q2
Defensive assets generally continued to perform well in the April-June quarter. April started with the US president introducing reciprocal tariffs, which weighed heavily on market sentiment. The strong risk-off tone throughout markets benefited bonds and gold as investors anticipated a global economic slowdown and further monetary easing by central banks. Driven by uncertainty, gold continued performing strongly, but it has become less attractive based on our long-term valuation metrics.
In May, defensive assets lost ground as some positive news on trade talks saw sentiment improving and bond yields rising. The market’s expectations for the Federal Reserve policy rate in 12 months’ time stabilised and returned to levels we consider more appropriate. Outside of the US, policy rate expectations remain far lower, with central banks in Europe, Canada, Australia and other countries moving rates away from restrictive levels. Among European markets, France in particular now offers attractive hedged yield opportunities for Japanese investors.
By June, defensive assets regained momentum. Regardless of the actions taken by Trump, financial conditions have continued to ease globally, and this should support economic growth. With carry returning to the market and economic conditions proving to be stronger than widely expected, spread products have become a favourable source of achieving stable income.
Defensive assets topic: high yield—optically tight
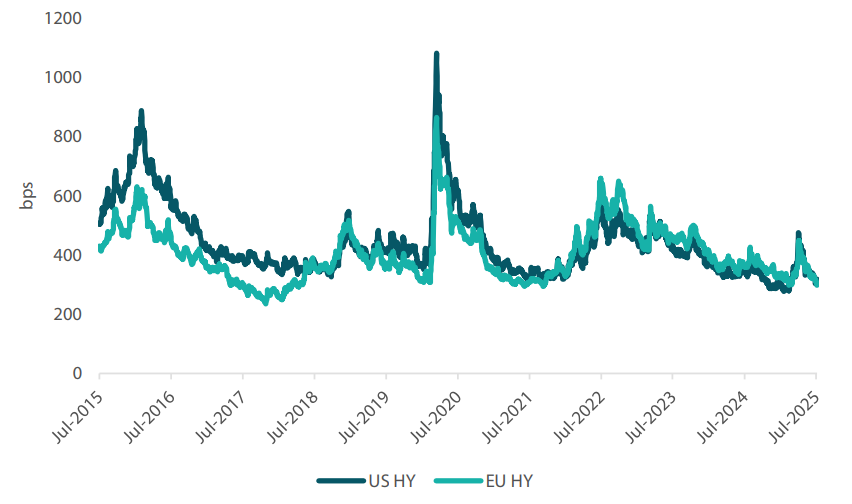
High yield stands out as an attractive asset class for multi-asset allocations, as it offers higher levels of return than traditional bonds while exhibiting much lower levels of volatility than equities. When making the allocation though, the question arises of when spreads become too tight and no longer warrant the allocation given the asset class comes with higher levels of default risk. As shown in Chart 4 below, high yield spreads are now approaching historically tight levels, suggesting that the allocation to the asset class should begin to be unwound. The US high yield segment is offering around +300 bps over government bonds, while European high yield sits slightly below +300 bps. From an allocation perspective, increasing your exposure when spreads are above 600 bps is the easiest way to time the cycle. This prompts the question as to why our portfolios are still inclined towards overweighting the asset class despite the tightening spreads.
Chart 4: High yield spreads-to-worst against government bonds
Source: Blomberg, July 2025
A factor often overlooked when observing credit indexes is the asset’s duration. While high yield spreads may appear to be compressing at the index level, this is also occurring along with a significant decrease in the asset class’s duration. For example, over the past 24 months, the spread duration of the US High Yield Index has dropped by over a year, from 4.4 years to just 2.7 years. As credit risk increases with time, this means that the extent of tightness in high yield spreads can also be affected by shifts in the asset’s duration underneath the index. In this instance, as high yield has shortened in duration by approximately 1.5 years, this could potentially results in a spread compression of 30–50 bps.
Chart 5: Durations of high yield indexes
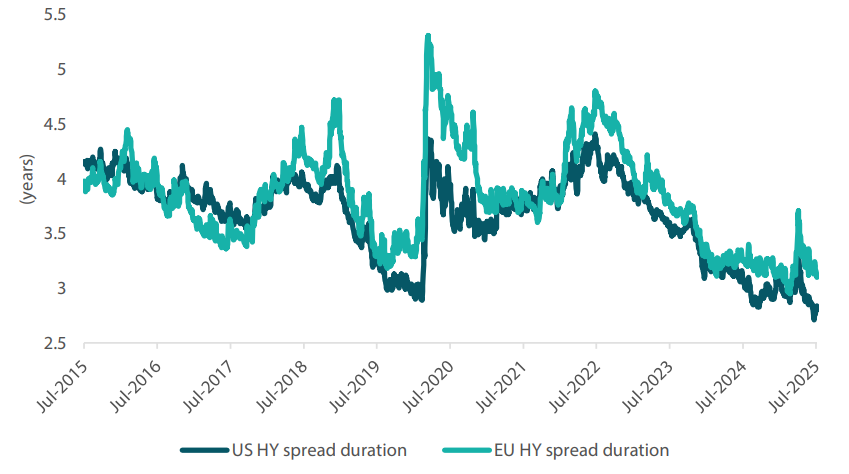
Source: Bloomberg, July 2025
A better measure to assess spread exposures throughout market cycles is dividing a spread by duration. This gives a duration-adjusted measure of spread, which offers a more consistent perspective on the asset class. As Chart 6 below shows, while spreads have contracted, they are still above their prior cycle lows. For example, in the US market, a further contraction of roughly 50 bps would be necessary for the spread to reach its prior lows, which would bring the asset class well below the +300 level currently observed. In addition to this, as described above, we remain positive on the macro outlook and expect rate cuts to further support global growth. By putting these factors together, we continue to see the merits of holding overweight high yield allocations and expect the asset class to contribute strong levels of yield to our portfolios over the coming months.
Chart 6: US, Europe spreads divided by their durations
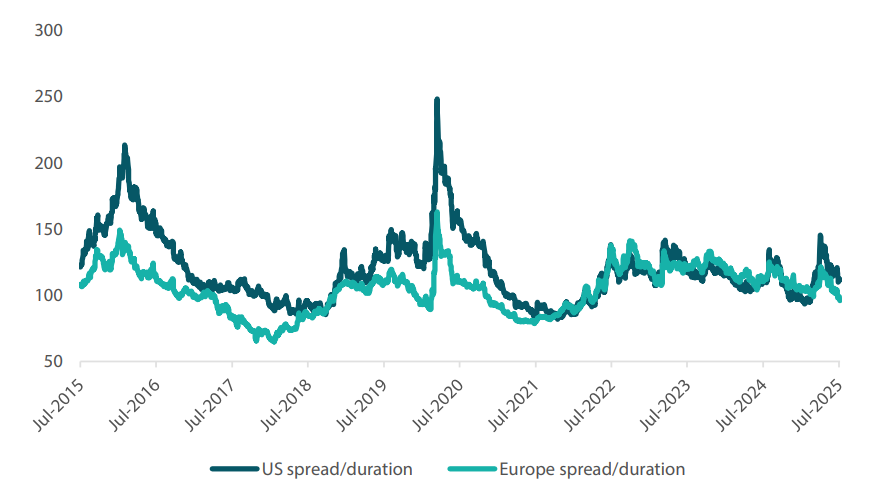
Source: Bloomberg, Nikko AM, July 2025
Conviction views on defensive assets
- Overweight high yield allocation : Credit spreads sold off during the April turmoil, which opened up short-dated opportunities. We believe that deals are going to be made on trade and that tax cuts will soon be on their way, which will be supportive of credit spreads in the shorter end. Additionally, high yield valuations remain somewhat attractive once accounting for the duration reduction of indexes.
- Gold reaches expensive valuations : After favouring gold as a hedge for the past 18 months, the metal’s price has now risen to levels that make valuations look expensive. Versus most asset classes, gold has outperformed and appears expensive against real assets such as housing and other commodities such as copper. While we like the idea of using gold for diversification, we listen to our process and have recently started to reduce our scores for what appears to be an expensive asset. The latest increase in the score of gold does not reflect any shift in this view, but rather a result of our recent update in our Strategic Asset Allocation.
- Overweight duration in selective countries : While we expect the trade deals to be less impactful than the market expectations, central banks do not have this luxury. With the risk of growth slowing, a number of central banks should continue easing, including the European Central Bank, Bank of England, Reserve Bank of Australia and the Fed. We like to use Australia as our overweight in duration as among the developed markets it has the largest link to China, and while trade deals could materialise for US allies, China will likely be singled out and face higher tariffs.
1 The Multi Asset team's cross-asset views are expressed at three different levels: (1) growth versus defensive, (2) cross asset within growth and defensive assets, and (3) relative asset views within each asset class. These levels describe our research and intuition that asset classes behave similarly or disparately in predictable ways, such that cross-asset scoring makes sense and ultimately leads to more deliberate and robust portfolio construction.
2 The asset classes or sectors mentioned herein are a reflection of the portfolio manager’s current view of the investment strategies taken on behalf of the portfolio managed. The research framework is divided into 3 levels of analysis. The scores presented reflect the team’s view of each asset relative to others in its asset class. Scores within each asset class will average to neutral, with the exception of Commodity. These comments should not be constituted as an investment research or recommendation advice. Any prediction, projection or forecast on sectors, the economy and/or the market trends is not necessarily indicative of their future state or likely performances.
