Snapshot
Market volatility appears to be resurfacing, as higher-than-expected inflation has cast doubt on the possibility of US interest rates being lowered in the near future. With the US maintaining persistent economic growth and running a large fiscal deficit, it now appears likely that the Federal Reserve (Fed) will not be able to cut rates as much as the market had previously expected. This makes long-dated US Treasuries less attractive than many strategists believe. However, markets such as the eurozone and Canada are beginning to see some potential for easing. As the market comes to grips with the US rate structure potentially remaining high, we expect to see increased market volatility and a potential return of the positive correlation between bond and equities that was evident in the market through 2022.
As previously mentioned in this series, we do not try to boldly predict how the investment universe may interact. Instead, we rely on statistical models that consider the natural drift of asset class volatility and correlations over time. Currently, this approach favours a larger allocation to gold, which has consistently offered a firm defence during market downturns. Additionally, the approach favours an overweight to energy-linked equities, historically known for their inflation-hedging capabilities. As evidence increasingly suggests that inflation is here for the long haul, we aim to take advantage of assets that perform well during inflation, while avoiding asset classes, such as long-dated fixed income, that tend to struggle.
Broadly speaking, we maintain a constructive outlook for equities, given the persistent economic growth in the US and the potential for lower rates in Europe that could invigorate their economy. The first quarter’s earnings reports have, on average, shown equities beating expectations. However, these successes have yielded little in terms of outperformance. Accordingly, we still see advantages to being overweight in equities, focusing on markets where we think high earnings per share (EPS) growth can be achieved; we favour the NASDAQ due to the influence of artificial intelligence (AI), and the TOPIX, as the weak yen offers Japanese companies advantages over their international peers.
Cross-asset1
We have maintained an overweight to growth assets, coupled with a neutral position on defensives. Within the US, strong fiscal support appears to be supporting the economy, with high levels of immigration bolstering economy-wide spending. We continue to hold a bullish stance on growth assets as earnings have largely surpassed expectations, and we expect continued economic growth to support the outlook for growth assets. Additionally, despite persistent inflation in the US, there are signs of it easing in Europe. Accordingly, monetary authorities outside of the US could soon begin initiating a rate-cutting cycle. This should be supportive of global growth and global equities in general.
We did not change the cross-asset scores within growth, with developed markets (DM) and commodity-linked equities continuing to rank highest due to their combination of growth and inflation-hedging characteristics. We maintained a smaller overweight to emerging markets (EM) equities. We maintained significant underweights to infrastructure and REITs, where yields are less compelling than current growth opportunities and still remain sensitive to a potential rise in yields.
Within defensives, we maintained our overweight to gold, which provides a hedge not just against growth assets but also against excessive government spending. We reduced our investment grade (IG) and high yield (HY) credit scores (further reducing their overweight standings), while increasing our DM sovereign scores. The reduction in our IG credit score reflects the fact that spreads are narrowing, and the potential for compression in certain markets, such as the US, is becoming increasingly limited.
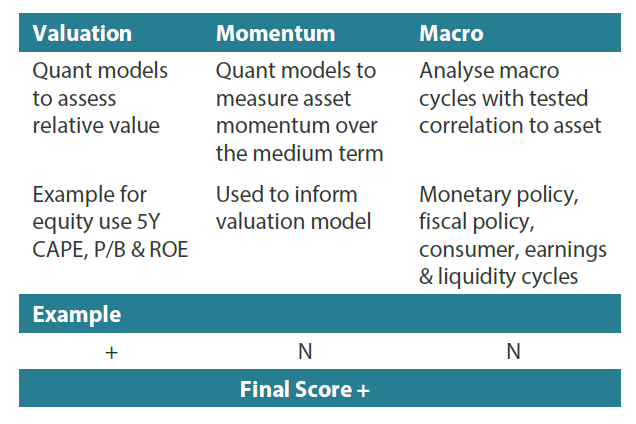
1The Multi Asset team’s cross-asset views are expressed at three different levels: (1) growth versus defensive, (2) cross asset within growth and defensive assets, and (3) relative asset views within each asset class. These levels describe our research and intuition that asset classes behave similarly or disparately in predictable ways, such that cross-asset scoring makes sense and ultimately leads to more deliberate and robust portfolio construction.
Asset class hierarchy (team view2)
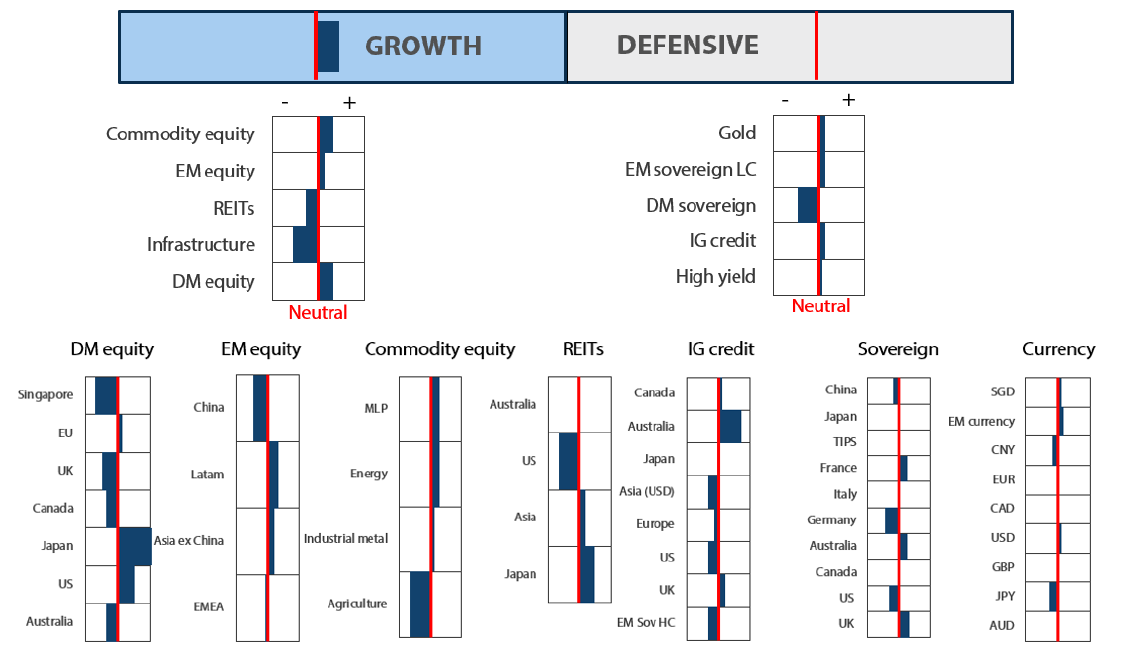
2The asset classes or sectors mentioned herein are a reflection of the portfolio manager’s current view of the investment strategies taken on behalf of the portfolio managed. The research framework is divided into 3 levels of analysis. The scores presented reflect the team’s view of each asset relative to others in its asset class. Scores within each asset class will average to neutral, with the exception of Commodity. These comments should not be constituted as an investment research or recommendation advice. Any prediction, projection or forecast on sectors, the economy and/or the market trends is not necessarily indicative of their future state or likely performances.
Research views
Growth assets
Growth assets experienced a downturn in April due to changing expectations regarding inflation and rates, even as pricing appeared more balanced across asset classes. However, growth gradually bounced back in the first half of May, mostly offsetting April’s losses, while energy and yields eased. Perhaps the standout performer this month is Chinese equities, which underwent a sudden surge.
Chinese equities appeared remarkably cheap back in January, and most of their year-to-date (YTD) rise is simply attributable to an increase in multiples. Naturally, price often precedes growth prospects, so this month we will review Chinese equities in comparison to growth opportunities elsewhere.
Continued caution on China equities
The rally in Chinese equities is quite impressive, having risen 27% from their trough in late January 2024. Even so, they are still down more than 50% from the high set in February 2021. As price follows earnings, the key challenge for Chinese earnings is their apparent stagnation. In fact, forward 12-month earnings have fallen by 18% over the last five years and decreased by an annualised 3%.
How much would one pay for this earnings trajectory? Not much. Still, a forward price-to-earnings (P/E) of 8x seen in January 2024 was exceptionally low. Now that the P/E has just gone over 10x—roughly where it stood five years ago—the question is whether earnings are set to adjust higher on better growth prospects ahead in order to justify the higher multiple. So far, identifying factors that could drive earnings higher is a challenge.
Chart 1: China earnings continue to disappoint
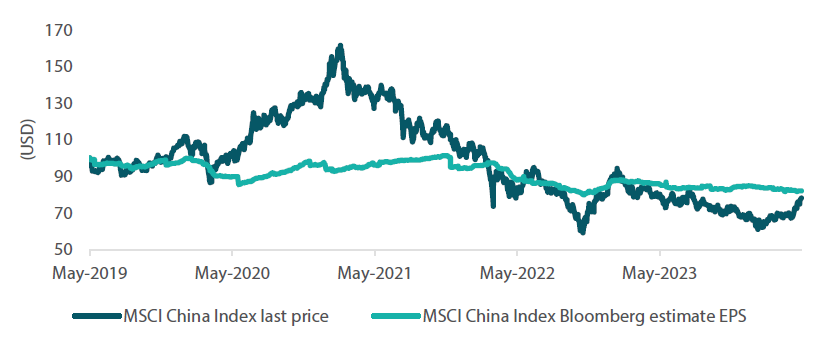
Source: Bloomberg, May 2024. Rebased to 100 in May 2019.
So far, China’s stimulus has mostly been ineffective. The property market remains extremely weak, and sentiment has not improved much as surplus capacity continues to exceed demand, which has been insufficient. China remains in a balance sheet recession, and while authorities have attempted to stimulate demand, the credit impulse has in fact been driven deeply negative—led by contracting bank loans—indicating that economic activity is at risk of further contraction.
Chart 2: China credit impulse back to negative
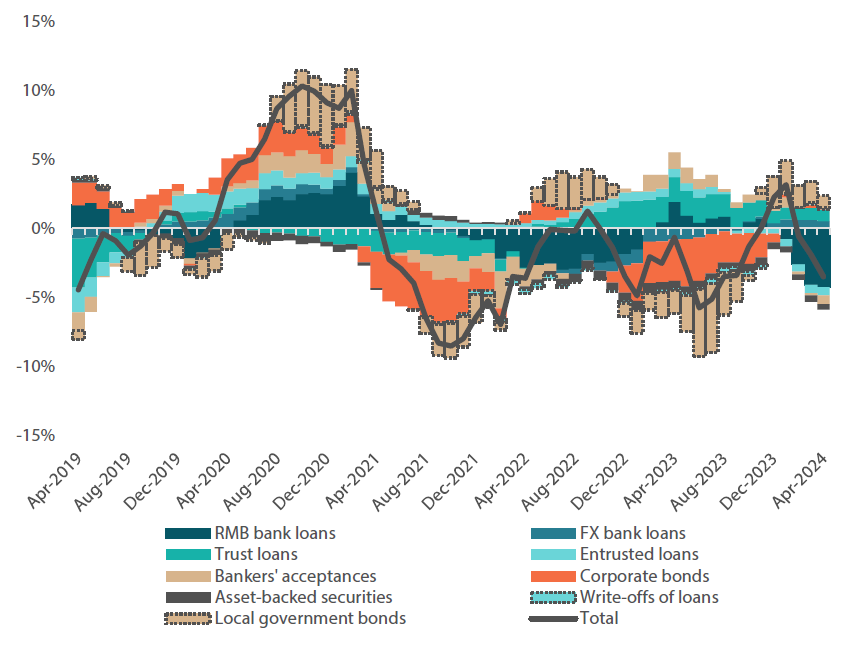
Source: Bloomberg, May 2024
Authorities may be doing the best they can to ignite a recovery, but based on all of the data, so far they appear to be falling well short of overcoming the overhang in property, debt and production capacity. Therefore, earnings are likely to remain challenged. A 10x P/E is still very cheap, offering a glimmer of hope to support the market. However, we still prefer firmer growth opportunities elsewhere, even if it means accepting higher multiples. Excess capacity and deflation present headwinds to top-line growth and earnings. A rise in purchasing prices would at least give some indication of a better balance between supply and demand, but we are yet to see such hints. China may still present interesting long-term opportunities, but for the moment we prefer to wait given the stronger opportunities in other places.
Conviction views on growth assets
- Commodity-linked equities: The asset class has performed well with respect to upside inflation surprise and helping to hedge the rise in rates. We still favour the asset class for valuations and hedging characteristics even if inflation risks may be mostly priced and present.
- Japanese equities: This continues to be a favourite regional allocation due to Japan’s structural reforms. Japanese equities are well ahead of other geographies YTD, and we see scope for broadening opportunities as other regions begin to cut rates.
- US secular growth: US tech-related stocks have mostly moved sideways since February; more recently, they took back losses from April. We still see significant upside in the sector while three months of consolidation is healthy to support upside ahead.
- Overweight to Europe: We believe Europe provides balance in a portfolio context, offering value and cyclical growth opportunities at still attractive valuations with rate cuts seemingly ahead. UK also presents valuation opportunities with likely rate cuts on the horizon.
Defensive assets
Changes within defensive assets were relatively small this month, with some adjustments made within IG and HY credit to shift towards higher-yielding exposures. Generally, exposures for US HY were reduced, while Australia remained the largest overweight within IG credit as it provides higher hedged yields. For DM sovereigns, the Australian position was maintained as they still offer attractive yields on a hedged basis, although this may be reviewed in the coming months given that Australian bonds outperformed over the past three months and inflation in Australia continues to exceed that of other DMs such as Canada, the UK and the eurozone. Gold was maintained as an overweight and is considered as a stabilising factor for portfolios given the high level of fiscal spending occurring across the globe.
Rate cuts, curve shapes and hedged yields
For the past six months, we believed that the eurozone would likely begin cutting interest rates first, considering its weaker inflation and growth situation relative to the US. As we progress through 2024, this is now becoming the market’s preferred narrative, and the European Central Bank (ECB) is expected to start cutting rates in the next three months. Over the last six months, we were reluctant to position too aggressively for such an easing due to the shapes of highly inverted yield curves. However, as we approach the beginning of the rate-cutting cycle, stronger opportunities to generate income should emerge, in our view.
We believe that more attractive defensive opportunities should emerge over the next few months because highly inverted yield curves had made hedging costs prohibitive, in turn rendering offshore bond markets expensive to own. For example, while outright yields in Europe reached 10-year highs, the yield level with hedging costs accounting for meant that Japanese investors where actually receiving some of the lowest levels of income since the early 2000s. Unlike in the early 2010s, when outright yields where at similar levels, it is currently harder for a Japanese investor to generate income despite credit yields of almost 4% in European terms. Hence, while we thought the ECB would be first to cut rates as early as late 2023, we found it difficult to be too overweight on these markets’ defensives. The holding costs of waiting for rate cuts to occur were simply too high.
Chart 3: European yields vs. hedged yields available to Japanese investors
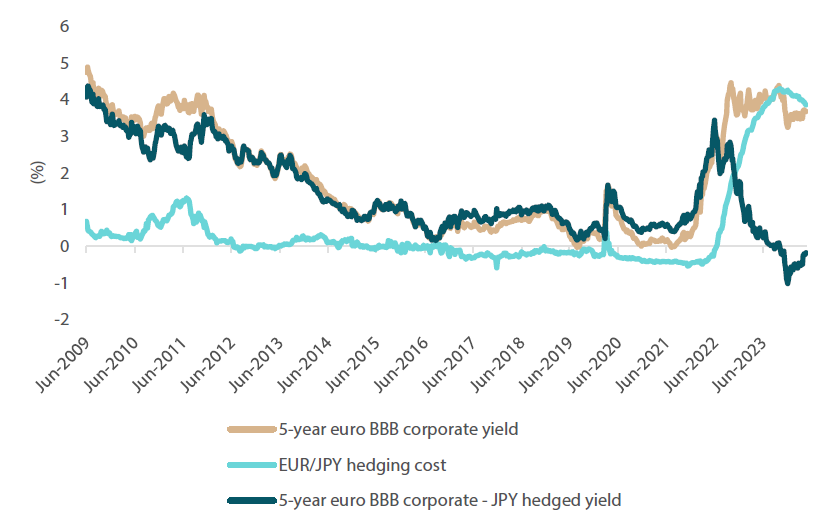
Source: Bloomberg, Nikko AM, May 2024
However, as rate cuts loom in Europe, the UK and potentially Canada, the holding period of owning low-yielding assets will decrease. This raises the question of where yields can be potentially generated in the future. Since the poor levels of hedged yield are a result of the shape of the bond yield curve, curve steepening will come into focus. For the three markets mentioned above, interest rate cuts are likely to become one of the main factors that cause yield curves to steepen. This can be seen in Chart 4 below for Germany, where the yield curve has flattened significantly during periods of rate hikes and steepened substantially with the first rate cut of the cycle.
Chart 4: German bond yield curve and ECB rate cuts and hikes
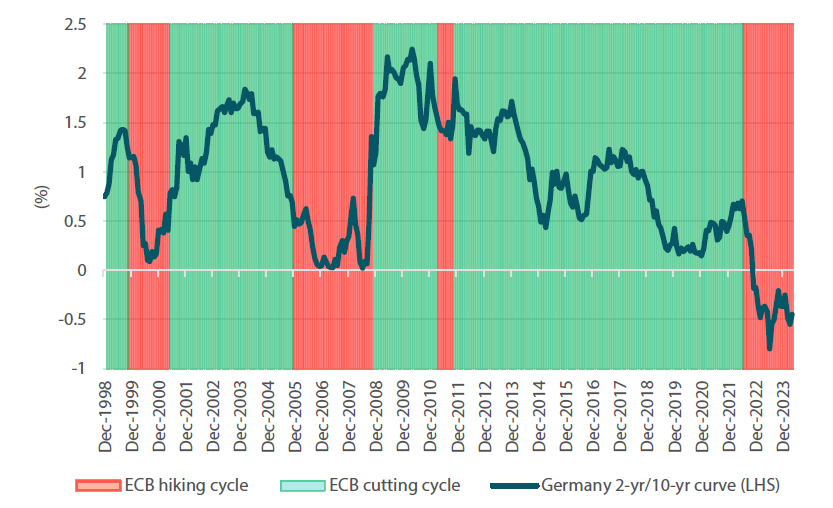
Source: Bloomberg, May 2024
Accordingly, while the cost of owning these markets still remains high, the imminent possibility of rate cuts now makes them more appealing. Since we expect bond yield curves to steepen when central banks begin cutting rates, we still favour the zero to 5-year part of the curve. Extending the portfolio might become appealing once the curve begins steepening. For investors required to hedge their bond exposures, hedging costs may decrease substantially in markets outside of the US.
Conviction views on defensive assets
- Short-dated IG credit: Credit spreads remain at fair levels, but many markets still exhibit inverse yield curves, making longer-dated credit less appealing. Until curves steepen, shorter-dated credit is likely to remain our preference.
- Gold remains an attractive hedge: Gold has been resilient in the face of rising real yields and a strong dollar, while proving to be an effective hedge against geopolitical risks and persistent inflation pressures.
- Attractive yields in EM: Real yields in this sector are generally very attractive, and we have a preference for quality EM currencies with dollar strength potentially easing due to prospects of US rate cuts later this year.
Process
In-house research to understand the key drivers of return: